flames
A personal finance app using location awareness to democratize data to users

— PROJECT NAME
flames
— ROLE
Owner
Product Design
Software Engineer
— DATE
08/2020
Traditional personal finance apps like mint, co-pilot, clarity money shed light into how you are spending money every month given you link your bank accounts to their product. However, when you are actually getting enlightened about your spending by opening the app, you are most likely in the comfort in the home and not about to make a financial transaction.
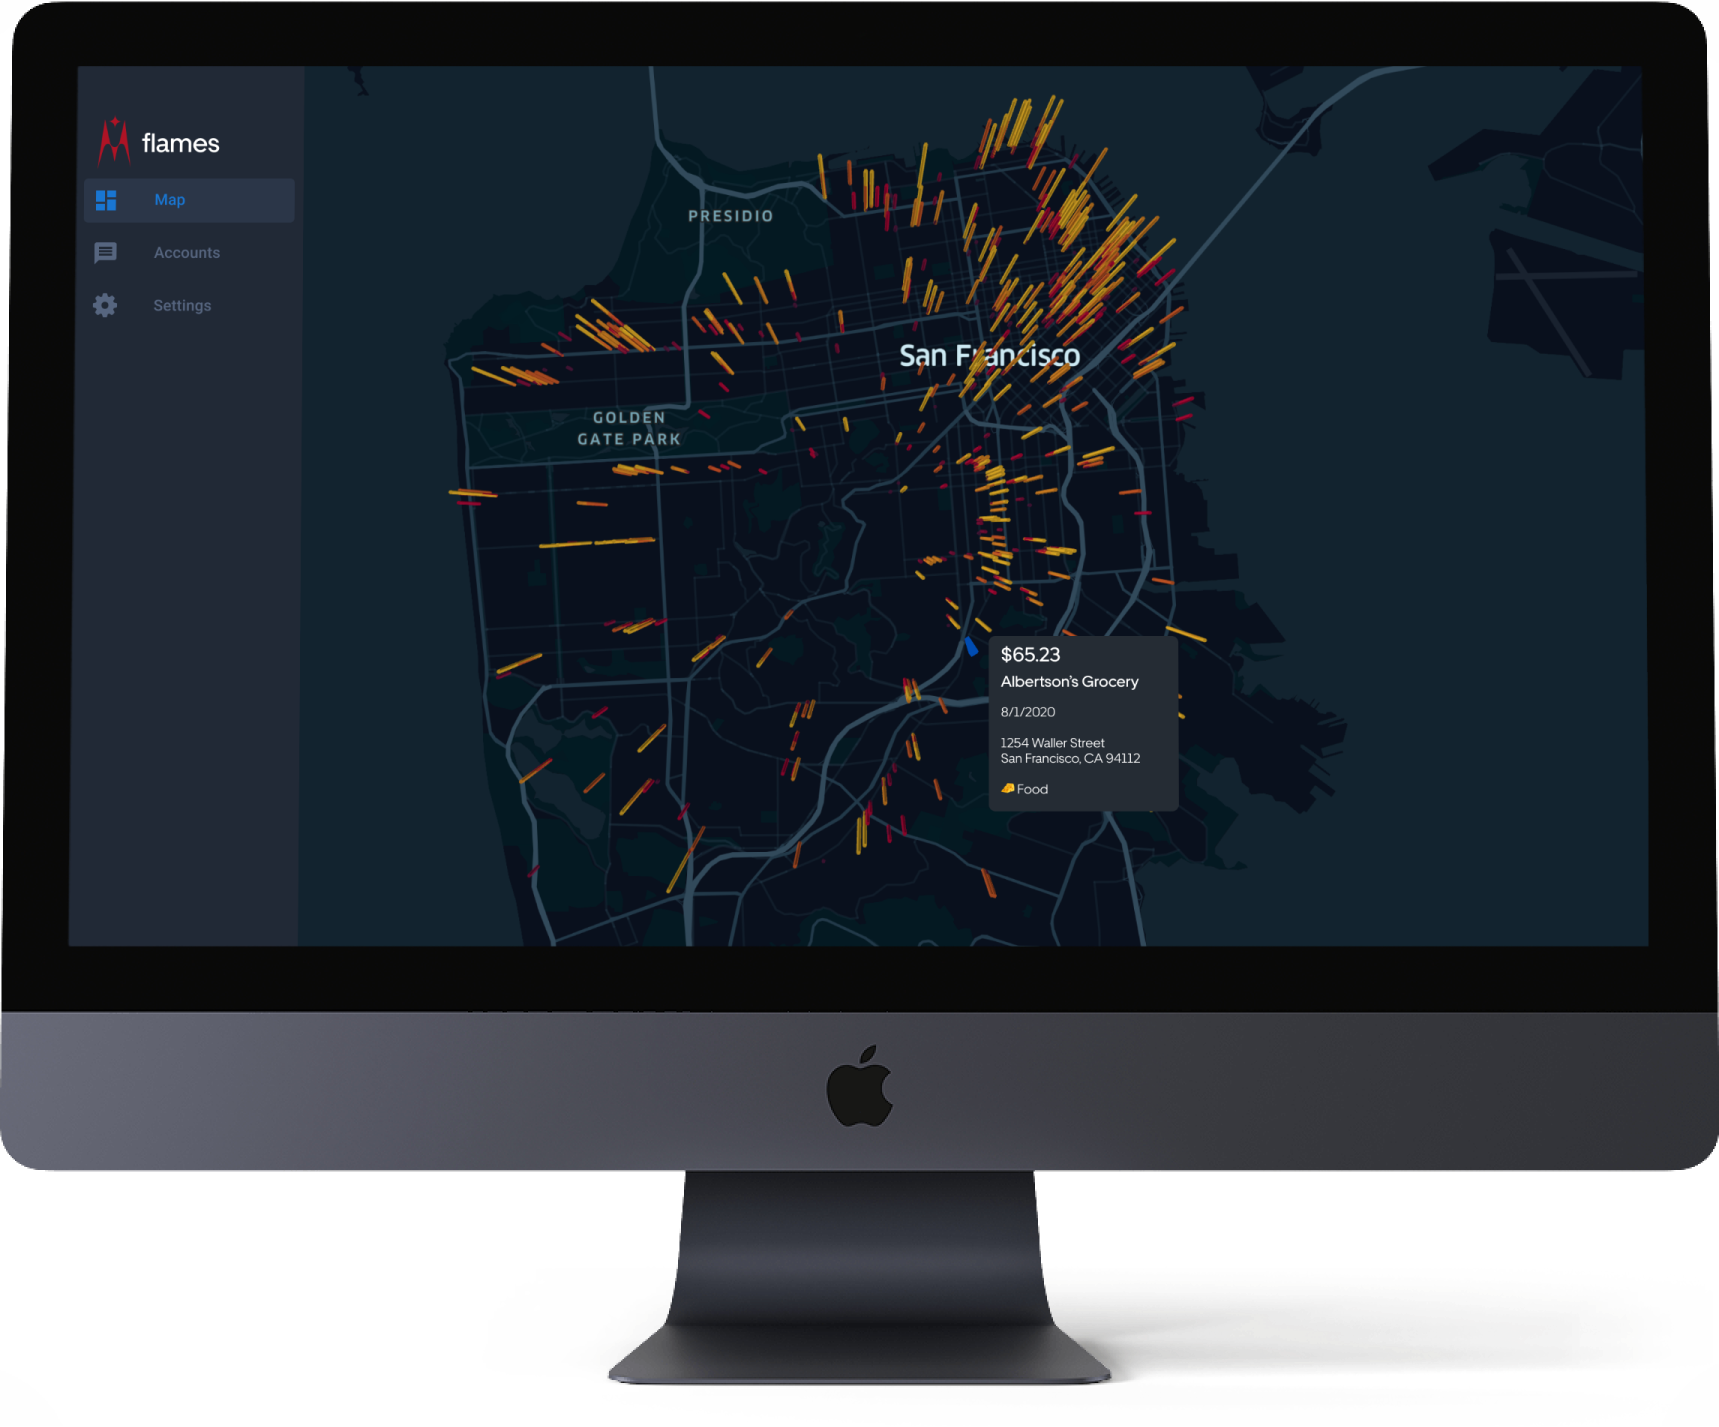
The premise of flames is that our lives are movements through time and space. Financial transactions in particular have a space element to it, (latitude and longitude), whether that be going to your favorite coffee shop in your neighborhood, or the shops you visited while traveling to Jackson hole, Wyoming.
Currently, there is no way to query this data that we all have at our fingertips. Flames democratizes your financial transactions and allows you to visualize your spending through time and space.
Statecharts – Designing the system rather than just flows

Geolocated transactions with the minimal amount of steps to the map is the core MVP flow
I used statecharts to model out the core MVP features. The goal is to get the user to link their own bank account with the credit card or debit card where they spend most of their transactions. From this, then we get to the map where all the transactions with latitude and longitude coordinates are displayed.
To test out that this idea was possible, I jumped in and signed up for a Plaid API key and started prototyping the backend in firebase firestore. Since this is a NoSQL database, it’s straightforward to store JSON objects without having the need to flatten, however, in order to design a proper schema, care must be taken in how to draw relations between transactions, users, and items.
Prototyping the backend with node and firebase cloud functions

Designing the NoSQL schema so that each user can have multiple financial institutions and multiple accounts under each institution

Core designs from onboarding, plaid link to navigation on mobile

Critiques on flames
User trust is a huge assumption:
Getting users to link their sensitive financial information requires a lot of trust on their part. However, if the value is clear and understood upon first entry, and if security concerns are met (bank level security, sufficient encryption) then users who are seeking to understand financial transactions through time and space would sign up.
Not all transactions have a geolocation – look at e-commerce, especially in the age of coronavirus.
Approach 1: Use physical business lat, lon coordinateEven though e-commerce transactions are done over the internet, the merchant has to be registered with a physical business address in the US. Hence, we can take that geolocation and use it as a reference point for the map.
Approach 2: Lump all transactions with lat lon points in a H3HexagonLayer that can be toggled on and off with the ability to drag and drop next to your transactionsBy lumping all transactions in a H3 hexagon layer, we still keep the relation that the amount of each transaction is the height of the bar, and thus e-commerce transaction can be accurately compared to physical transactions.
Plaid API calls are expensive, especially as you scale – how are you going to make money?
A subscription model could be one form of monetization, however, there are so many personal finance apps especially ones that are free that it would be hard to compete in this domain.
Another approach would be to aggregate transaction data and use that data to sell to real estate brokers. By having data on where large clusters of the city have commerce, this can be used to better price real estate.
Success Metrics:
% converted from top of funnel landing page to bottom of funnel after linking account
number of interactions of scrolls, pans, zooms on the map layer
retention, % users coming back per week
Next steps:
Build, build, build
In addition to building out the frontend and backend to make this idea a reality, there is also more features to be added. This iteration of flames is just the features needed for a core MVP to test out the idea of mapping transactions.
Some potential features:
Personalized location jumper for Map view
Text message after a transaction has occurred, telling users what their mean (average) transaction size at that merchant was and other statistical data
Implement a standard cookie cutter budget based on how much they make and where they live